I recently attended a seminar at Saw Swee Hock School of Public Health. It featured Professor John Ioannidis from Stanford University who gave a fascinating talk on common pitfalls in the conduct and interpretation of meta-analyses, and some of the cutting-edge developments in the field. I thought I would share some highlights here.
Systematic review, as the name implies, is the review of literature in a systematic manner that is described transparently. If the studies are considered to be sufficiently similar, a statistical tool named meta-analysis is used to summarize the findings. So, a systematic review may or may not include a meta-analysis.
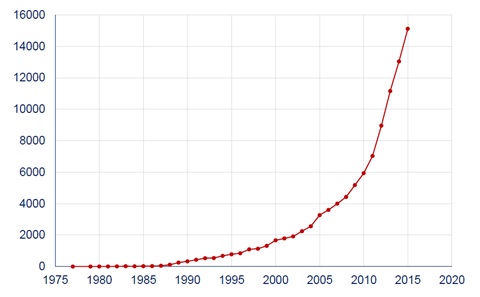
Systematic reviews and meta-analyses are considered to be the strongest tool for evidence-based medicine, and are crucial to formulate health policy and produce clinical practice guidelines. In recent years, there has been a soaring number of meta-analysis studies (Figure 1). But how good is the quality of evidence?
Fleming and colleagues examined systematic reviews from the Cochrane Database of Systematic Reviews from January 2013 to June 2014. The Cochrane is an independent, non-profit organization that conducts systematic reviews of randomized controlled trials (RCT) of health-care interventions and diagnostic tests. Cochrane reviews are considered to have higher quality of methods and reporting than systematic reviews elsewhere. Fleming and colleagues identified 1394 Cochrane reviews. Of these, 44% were summarized using the GRADE (Grades of Recommendation, Assessment, Development, and Evaluation) tool. The GRADE tool allows appraisal of systematic reviews, and it has been adopted by Cochrane since 2008. The quality of evidence for the first listed primary outcome was high only in 14% of the studies. These results are alarming.
One reason of the poor quality of the evidence is that the goals of the studies are often influenced by vested interests of the industry. In comparison to Cochrane reviews, industry-supported ones are less transparent in reporting, and are much more likely to make positive conclusions on the experimental treatments. Otherwise, companies may fear that they may lose the market share.
Not only the reviews, the companies often rig the design and results of RCTs, and manage to get the results that they want most of the time. A recent study looking at trials published in 2011 showed that, 83% of industry-supported trials had a favorable outcome compared to 59% of trials funded by non-profit institutions. In addition, 55/57 of non-inferiority trials sponsored by the industry demonstrated non-inferiority, a success rate of 96.5%. In a non-inferiority trial, a novel treatment is compared to an established one with a view to demonstrate that the novel treatment is not clinically worse than the comparator.
To better manage the industry sponsorship with a view to maintain independence in conducting a RCT, some important questions need to be answered: Is transparency in potential conflicts of interest enough? Who should be the sponsors and authors of RCTs, systematic reviews, cost-effectiveness analyses, guidelines, and other ‘sensitive’ studies?
The decision on what intervention (drugs, diagnostic devices, etc) to study is also problematic. The study also shows that most industry-sponsored RCTs were supported by a single company to study a single intervention; only a very small fraction was examined by different companies. When two companies sponsor the same trial, usually this reflects simply co-ownership of the same agents marketed by both companies.
Very often, systematic reviews and meta-analyses are conducted by different research groups with little coordination and communication between the reviewers. It is not surprising that overlapping meta-analyses on the same topic are published by different teams; it is a waste of the precious time and efforts of researchers. This could also create confusion among the readers. A study examined a random sample of meta-analyses published between 2010 and 2013, and found as many as 13 overlapping meta-analyses. Among meta-analyses on the same topics published at a later time, 23% included author(s) of the original ones; 65% did not include any additional outcomes. To fix this problem, the coordination and communication between reviewers need to be improved, and systematic review protocols need to be registered before the study is conducted. Also, previous meta-analyses on the same topic should be properly acknowledged.
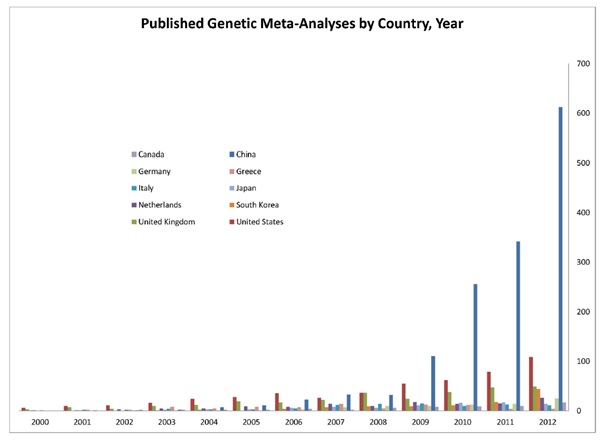
An interesting recent trend is the prolific ‘epidemics’ of meta-analysis in some sectors, in which the results are often unreliable. A study by Prof Ioannidis and colleagues evaluated the recent surge of meta-analysis studies from China, and compared the characteristics of the methods used to the studies from the US (Figure 2). The increase in meta-analysis studies by Chinese scientists is remarkable (40-fold increase in 2003-2011), mainly driven by genetics (110-fold increase). The majority of these meta-analyses looked at the genetic associations with certain clinical condition. But it is possible that most of these findings wrongly indicate the presence of a particular condition as it was previously shown that majority of these genetic associations cannot be replicated by other researchers.
There are also problems in meta-analysis of observational studies (ie, studies in which researchers observe participants and collect information without assigning interventions to the participants. For example, cohort study, case-control study, etc). These studies tend to focus on single or a few putative risk factors to an outcome of interest. However, there are massive number of risk factors published on a given outcome. Very often, the decision on which risk factor to study depends on many factors such as, what has been measured, or the researcher’s idea on what is important to adjust for, and so on. In addition, there is lack of consensus on whether to perform and report univariable, multivariable models or both. Further, risk factors are often reported after selecting the most ‘significant’ results from multiple models. Meta-analysis based on selectively reported studies may simply be biased too, even with the advent in post-hoc correction of bias. A recent study demonstrated field-wide meta-analysis as a useful way to consider all data on all assessed risk factors for the entire field (defined by a particular outcome). All risk factors and related information are systemically mapped in order to synthesize the current evidence, recognizing the degree of selective reporting, and potential biases. It also recommended the use of environmental-wide association studies to standardize, and the use of reproducible methods to identify risk factor variables.
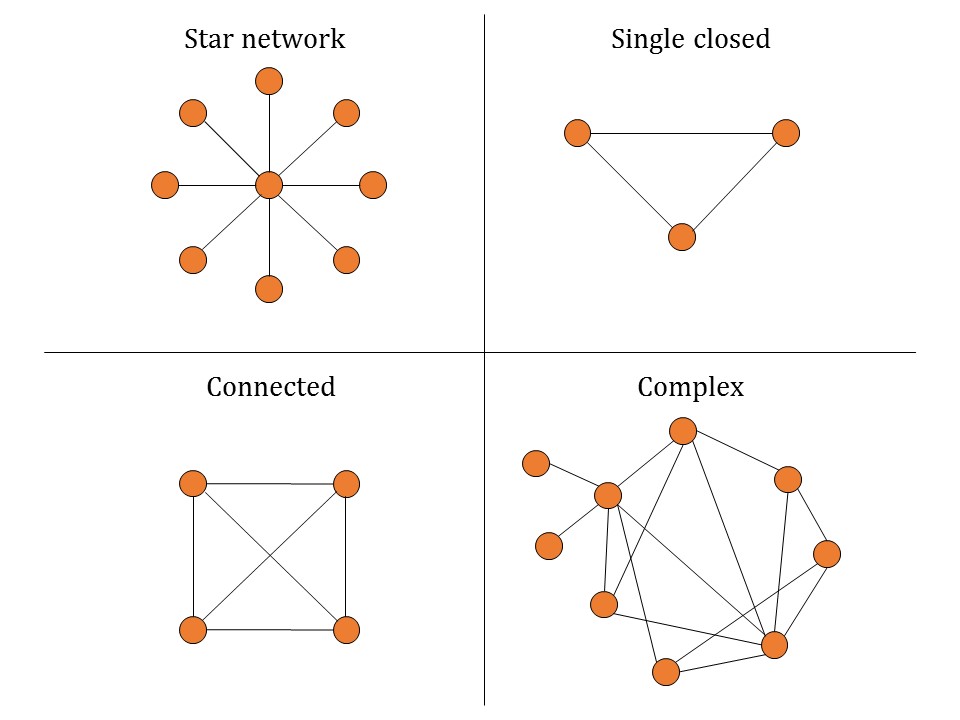
As for future directions, the use of network meta-analysis (NMA) and other novel methods and applications were mentioned. Through visualizing and interpreting all available comparisons of treatments of a disease of interest, NMA sheds light on how effective these interventions are in relation to each other. The main advantage of NMA is that one can indirectly compare two treatments if the comparison is not done directly in a RCT. NMA gives information on the characteristics of networks or network geometry (diversity, co-occurrence, homophily, auto-looping) (Figure 3), and synthesize the evidence by assessing summary effects of multiple similar studies combined, incoherence between studies, ranking of treatments, and extent of bias. You can read more about NMA here.
Prof Ioannidis also shared his vision on a paradigm shift – a move from network meta-analysis to meta-analysis networks. That is, networks of trials should be designed before the studies are conducted; all trials teams and experts join forces worldwide; data incorporated prospectively; network geometry pre-designed. Obviously, tons of challenges need to be overcome to achieve this but this effort would guide researchers what to study next, and advance the research agenda efficiently.
Meta-analysis provides the strongest evidence to guide clinical practice and support health policy formulation. However, while evidence is often sparse or of low quality in many instances, it is important to realize that a meta-analysis cannot fix this deficiency – it can only point to it.