
Edmund LOW
NUS College (previously University Scholars Programme)
Edmund shares his experience of developing a sequence of thematically similar courses for pre-university, undergraduate, and adult learners, including the learning issues which prompted the move to more deliberately sequence his course content, and how this process has been pedagogically beneficial to enhancing his practice.

Low, E. (2022, Sept 29). Scaffolding courses for fostering lifelong learning. Teaching Connections. https://blog.nus.edu.sg/teachingconnections/2022/09/29/scaffolding-courses-for-fostering-lifelong-learning/
As a believer in learning on a continued basis outside of university, I help develop and deliver carefully scaffolded courses for working professionals and pre-university students, to complement the core curriculum for current undergraduates.
The spur for this mindful, intentional scaffolding of material across what I teach stems from initial assessments from a couple of my courses: (1) “Developing Insights from Data” for pre-university students from Ngee Ann Polytechnic (NP); and (2) “Quantitative Data Reasoning Bootcamp” (QDRB) for working professionals. Though key questions touching on the overall mindset of using data were emphasised, I observed that the content was either too heavy for learners in the first instance, or they were too preoccupied with troubleshooting code in the second instance to have the desired takeaways (see Figures 1 and 2).


This made me consider a more conscientious, deliberate sequencing of courses for onboarding and reinforcing university education. The importance of thoughtful scaffolding for courses taken by adult learners has been emphasised in Salyers et al. (2014), including diverse occasions for interaction. Encountering more instances of the same topic during this learning journey breeds familiarity, and can motivate greater self-reflection on what has been covered.
Therefore, I endeavour to structure a sequence of similar thematic courses for pre-university, undergraduate, and adult learners, tailored at the appropriate levels. This series of courses provide a corridor of opportunity for students to see how the same topics connect with other learning experiences outside the classroom (e.g. a journal article, a presentation); such critical reflection is the sort of unstructured learning that will become the primary mode of learning post-university (Rodgers, 2002). Therefore, this curricular sequence can help promote such practices.
Of course, it is unrealistic to expect the same batch of students in every class along this curricular sequence. What I have done across these courses is to focus on broad themes, instead of module-specific details, for scaffolding. Such themes are what most learners encounter in the myriad quantitative courses they will take/have taken in their majors: (1) organising datasets; (2) using models; (3) extracting insights from data. However, the scaffolding is not simply a repeat of the content, but rather organised and tailored with the audience in mind, with varying emphasis on the time devoted to skills-based training versus mindset concerns.
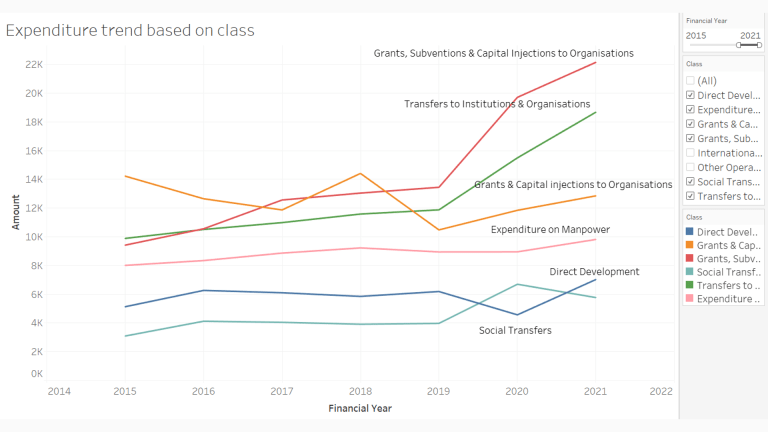
For example, in the course “Developing Insights from Data” for pre-university students from NP, my undergraduate module UQF2101I “Quantifying Environmental Quality”, and QDRB for adult learners all cover: (1) cleaning messy data (organising datasets); (2) linear regression (using models); and (3) statistical inference (extracting insights). Reflecting upon the issues described earlier in this article, for the NP workshop, these topics are now covered through the lens of accessible data visualisations using the intuitive user-interface-based software Tableau (Figure 3). For UQF2101I, we delve into these topics in greater depth, using detailed Excel worksheets. While for QDRB, I now provide prepared code segments for the adult learners, shifting the focus from troubleshooting code to reinforcing core data reasoning mindset and skillsets that participants have learned previously in university, while still imparting useful coding knowledge.

Assessments and feedback from the respective courses show favourable outcomes in making connections and applying scaffolded content, demonstrating the potential benefits of this sequence of courses in promoting critical reflective practices. For instance, for the NP workshop, prior to the aforementioned changes in streamlining the content, only one out of the 12 project groups across the first two runs were utilising quantitative evidence sources learned in the workshop towards answering their chosen project question. With the shift to a narrowed focus on data visualisations, 9 out of the 12 project groups in the subsequent two runs were mindfully applying what they learned in the course, such as the representative sample shown below (Figure 4).
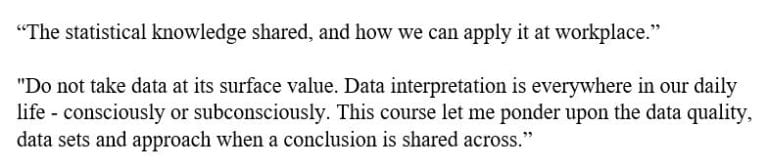
For QDRB, participants went beyond the coding skills learned, and successfully applied the quantitative framework (the key objective of the course), connecting it towards answering questions in their own professional spheres. A couple of excerpts of learner feedback, in response to the question “What are your key takeaways from this programme?”, demonstrates the positive impact of these changes:
Another tangential benefit from developing this sequence of thematically connected courses is that it helped inform my teaching. For instance, teaching courses on Tableau opened my eyes towards the pedagogical advantages of softwares which streamline the visualisation creation process. Having this immediacy between what students learn, and putting what they see into practice, is an aspect that has been shown to promote retention (Wagner, 2014), thereby motivating me to employ similar softwares for other courses in this curricular sequence, such as UQF2101I.
Looking ahead, for the NP workshop, currently a minority of project groups are still not employing quantitative sources of evidence. My aim for future iterations is to increase this proportion by working more closely with the various groups during the ideation stage, in sourcing for appropriate datasets, and in considering how visualisations can be used to explore, glean, and communicate insights from these datasets. For QDRB, I aim to more closely integrate the coding and mindset portions of the course, so that the adult learners are not only able to articulate how data can systematically and logically be used to answer questions in their workplace, they can also apply the coding skills learned to directly solve these questions.
 |
Edmund LOW is a Senior Lecturer at NUS College, where he is pillar coordinator for Reasoning with Data. He has taught courses on environmental engineering, data science, as well as health and safety. His experience and interests include the use of computational modelling and data-driven tools, applying them to solve problems in public health, water resource management, and air quality in buildings. Edmund can be reached at edmundlow@nus.edu.sg. |
References
Rodgers, C. R. (2002). Defining reflection: Another look at John Dewey and reflective thinking. Teachers College Record, 104(4), 842–866. https://doi.org/10.1111%2F1467-9620.00181
Salyers, V., Carter, L., Cairns, S., & Durrer, L. (2014). The use of scaffolding and interactive learning strategies in online courses for working nurses: Implications for adult and online education. Canadian Journal of University Continuing Education, 40(1). https://doi.org/10.21225/D59S3Z
Wagner, E. A. (2014). Using a kinesthetic learning strategy to engage nursing student thinking, enhance retention, and improve critical thinking. Journal of Nursing Education, 53(6), 348-351. https://doi.org/10.3928/01484834-20140512-02
