
LIM Li Zhen
Faculty of Dentistry
In the concluding part of this two-part blog post series, Li Zhen talks about how reports generated by ExamSoft can help educators evaluate both individual student performance and the quality of assessment questions. You can read Li Zhen’s first post here.

Lim L. Z. (2022, Feb 25). Useful feedback with ExamSoft Reports, Part 2: Evaluating individual student performance and item analysis. Teaching Connections. https://blog.nus.edu.sg/teachingconnections/2022/02/25/useful-feedback-with-examsoft-reports-part-2-evaluating-individual-student-performance-and-item-analysis/
In the second part of this two-part blogpost, I will share how ExamSoft1 can be used to evaluate individual student performance and the quality of questions in the assessment. The evidence gathered from these analyses can be used to inform student learning as well as improve assessment practices.
Using the “Exam Taker Strengths and Opportunities” Report to Evaluate Individual Student Performance
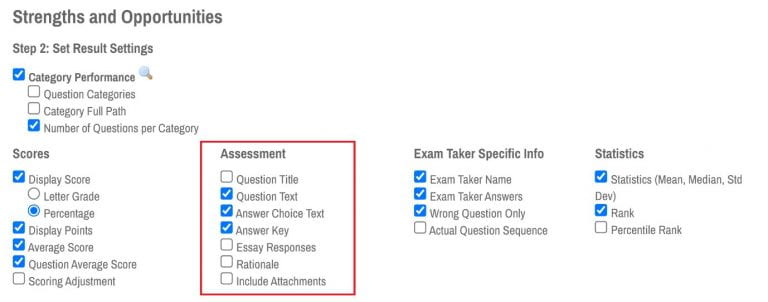
This is a report that I prepared before I meet individual students for a test review. One note of caution–it is possible to release the questions and answers in their entirety, so do double-check the options selected for the report, especially if question banks need to be kept confidential. (Refer to the red box in Figure 1).
The first part of the report (see Figure 2) shows the student’s score compared to the class’s average, and their rank in class. It also provides an overview of the various categories, including how the student performed in each category and in comparison to their peers. The orange circles and red triangles in Figure 2 highlight the areas that they need to improve on. (Check out Part 1 of this blogpost to read more about question tagging and categories)

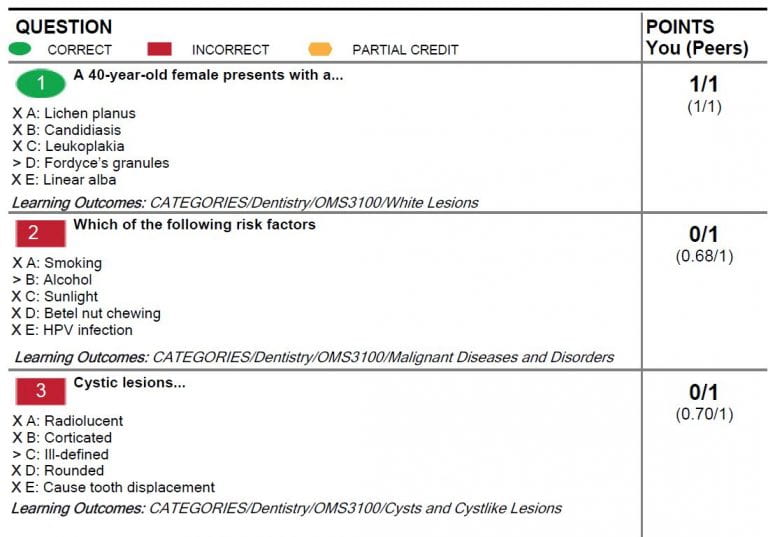
The next part of the report (Figure 3) covers each assessment question. Under the “Points” column (Figure 3), the numbers in bold reflect how many points the student scored out of the maximum score. The figures in parentheses in the “Points” column reflect the average class score for that question.
Using Item Analysis to Evaluate Question Quality
After each assessment, it is good practice to review the quality of the questions to decide whether the item should be kept, revised and improved, or discarded. The “Item Analysis” report provides useful information for this process.
A good question has the following features (Table 1):
Table 1: Features* of a good assessment question
Item Statistic Remarks
Item difficulty
Percentage of students who answered the question correctly
Ideally between 0.5 to 0.9 (50% – 90%)
Discrimination Index (DI)
Difference in percentage of students in the top 27% and bottom 27% who answered the question correctly
Greater than 0.3 (30%)
Response frequencies for Multiple Choice Questions (MCQs) All provided distractors are plausible
Good distractors are able to distract low scorers more than high scorers
*Note: The figures cited are guidelines and not rules, and different sources will cite varying ranges.
The example below (Figure 4) shows a question that had moderate difficulty and good discrimination.
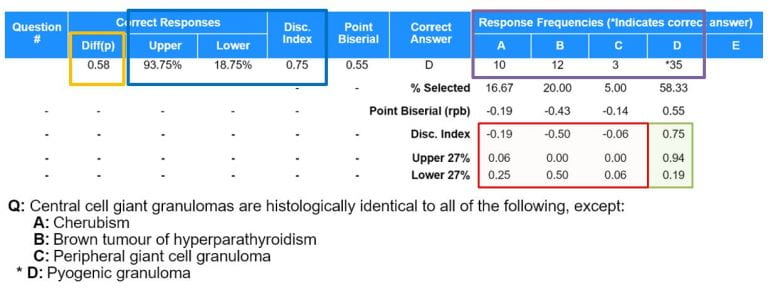
Here, a difficulty score of 0.58 (yellow box) indicates that 58% of students answered the question correctly by selecting option D. Next, among the top 27% of test scorers, 93.75% managed to answer this question correctly, compared to 18.75% of those in the bottom 27% (blue box). This gives us a Discrimination Index (DI) of 0.75 (which is the difference between the 93.75% and 18.75%). This tells us that this question has good discriminatory abilities.
Reviewing the response frequencies (purple box), A and B are good distractors, compared to C, which only three students picked. So for future assessments, I would need to modify distractor C. Additionally, when reviewing the DI of the distractors (red box), we can see that more of the lower 27% chose the incorrect options compared to the top 27%, which is what we want to see in good distractors.
Conversely, this next question (Figure 5) provides a negative example of an assessment question.

Firstly, the difficulty score is 0.98 (orange box), which sounds counterintuitive, but indicates that 98% of students answered the question correctly. Next, all students in the top and bottom 27% answered this question correctly, leading to a DI of 0 (blue box). This means that this item is very poor at discriminating strong and weak students. Finally, looking at the response frequencies (purple box), we can see that the distractors are very poor. Nobody chose B or C, and only 1 person chose A. Correspondingly, the DI of all possible responses is 0 (red box).
In summary, this item may need to be discarded from future use. There are some exceptions to this, for example, if the question tested an important concept that students absolutely must know or if it was an area that an instructor emphasised frequently during class.
Takeaway Tips
- The “Exam Taker Strengths and Opportunity” report is useful for engaging in a feedback conversation with individual students. However, be careful about releasing assessment questions and answers in their entirety.
- Item statistics in the “Item Analysis” reports are useful indicators of question difficulty and can inform whether the question is able to discriminate between strong and weak students.
- Response frequencies in the multiple-choice questions (MCQs) and the discrimination index of distractors will indicate whether a distractor needs to be discarded or modified.
- Carrying out item analyses with colleagues can help develop a common understanding of the quality of items for assessment and feedback.
 |
LIM Li Zhen is a Senior Lecturer at the Faculty of Dentistry. She teaches modules in oral radiography and radiology to undergraduate and postgraduate dental students. Her research interests include evaluating the diagnostic impact and efficacy of imaging, and the use of technology-enhanced learning in dental education. Li Zhen can be reached at denllz@nus.edu.sg. |
Endnote
- Colleagues can refer to the Digital Assessment page (https://wiki.nus.edu.sg/display/DA/Self+Help) for details on how to set up ExamSoft. This wiki is only accessible to NUS staff.
Useful References
Gan J. S., & Wu H. X. (2019). Using ExamSoft for digital assessment and feedback [Seminar]. Centre for Development of Teaching and Learning.
Rudolph, M. J., Daugherty, K. K., Ray, M. E., Shuford, V. P., Lebovitz, L., DiVall, M. V. (2019). Best practices related to examination item construction and post-hoc review. Am J Pharm Educ, 83(7), 7204. http://dx.doi.org/10.5688/ajpe7204
