
LIM Li Zhen
Faculty of Dentistry
In the first of a two-part blog post series, Li Zhen discusses how summary reports created using ExamSoft can be used to evaluate overall class performance and to provide feedback to students.

Lim L. Z. (2022, Jan 27). Useful feedback with ExamSoft Reports, Part 1: Creating the question bank and summary report. Teaching Connections. https://blog.nus.edu.sg/teachingconnections/2022/01/26/useful-feedback-with-examsoft-reports-part-1-creating-the-question-bank-and-summary-report/
ExamSoft1 is a secure online assessment platform that can provide insights into student learning. In the first of this two-part blog post, we will share how ExamSoft can be used to organise question banks and evaluate overall class performance. The feedback derived from ExamSoft can be used to inform students’ learning and to evaluate one’s own teaching impact.
Tagging Categories to Questions and Question Bank Organisation
When creating any question item, the item can be tagged to one or more categories. These categories can include the assessment’s name or date (Figure 1, in blue), or the question’s topic (in green). For example, in Figure 1, I can tag a question with AY2020/21 Continual Assessment (CA) which is the assessment that the question will be used in, as well as “Basic Histology” and “Cystic Lesions”, which are the topics associated with that question.

After all the questions have been created, they can be viewed in the question bank. This will contain a list of all the question items, and the associated tags. This is an easy way to review when the question was last used for assessments (Figure 2, blue boxes), and which topics were tested (Figure 2, multi-coloured boxes). Alternatively, to view all questions from a particular topic or assessment date, you can select the respective category from the list on the left.

Using the Summary Report to Evaluate Class Performance
After the assessment is completed, a Summary Report can be generated (Figure 3). The first part of the report shows the class’ average test score (Box A), the highest and lowest scores (Box B), and the overall class performance on a histogram (Box C). The KR-20 score (Box D) reflects the consistency of the test, or how likely it is that the student can repeat their assessment performance again. The higher the KR-20 score, the better.

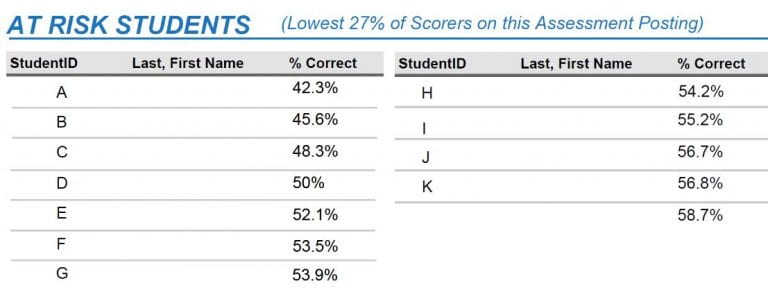
The report also highlights students who received the lowest scores who may be at risk, and may require more individual attention (Figure 4).
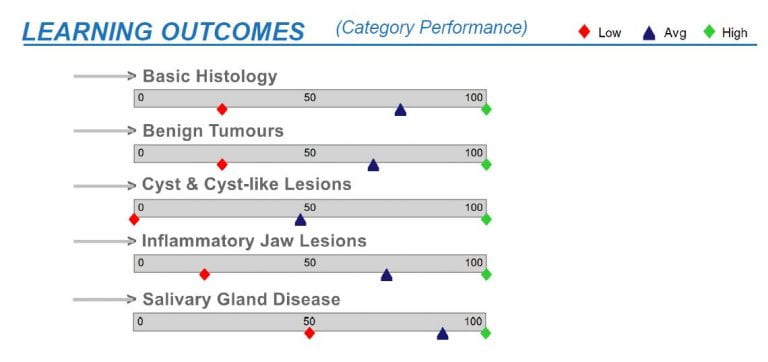
The next section summarises the class performance in each category (or topic) (Figure 5), including the range of the lowest and highest score (indicated by the red and green diamonds), and the average class scores (indicated by the blue triangles). This is where tagging the questions by categories comes in useful, as it allows identification of topics that students are weaker or stronger in.
In the final part of the Summary Report, each question’s item stem is displayed together with their item statistics (Figure 6).
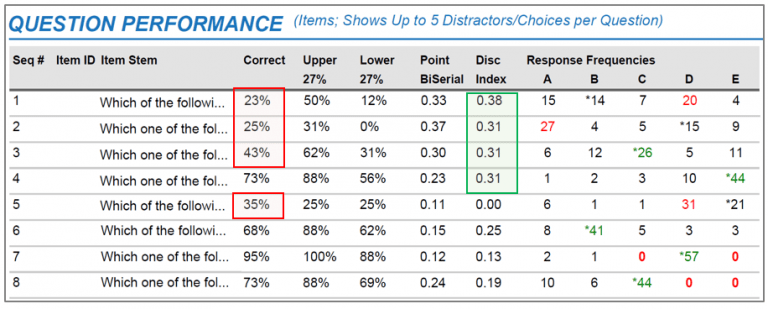
Firstly, as displayed in Figure 6, the percentage of students who answered the question correctly is a measure of question difficulty or ‘percent correct’. We can see here that there are several questions that less than half the students were able to answer correctly (e.g. Questions 1, 2, 3 and 5).
This table also shows the percentage of students in the top 27% and bottom 27% who answered each question correctly. This is a measure of the ability of the question to discriminate between high and low scorers. This difference is reflected in the Discrimination Index (DI), which ideally should be >0.3. This means that we want at least a 30% difference between the percentages of high-scoring students and low-scoring students who were able to answer the question correctly. In this example, Questions 1 to 4 have acceptable DI scores.
Finally, the Response Frequencies can reveal students’ understanding of a topic through their answer choices, and also inform faculty of the quality of the distractors. These parameters will be discussed in the next blog post “Part 2: Evaluating Individual Student Performance and item Analysis”.
Providing Feedback to Faculty
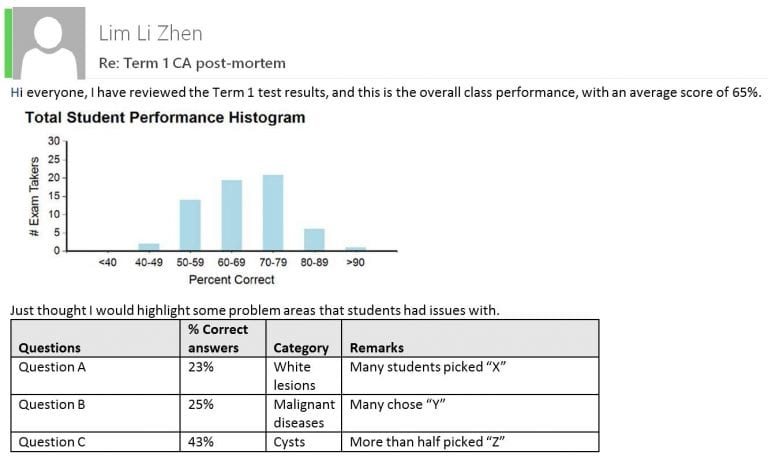
As the module coordinator, I would summarise the class performance for faculty colleagues who were involved in teaching the module and setting the questions (Figure 7). The information provided via email would include the performance histogram, average scores, and the number of students who failed, if any. I also highlight the questions where less than half the students answered correctly. These are areas that the respective faculty can address in tutorials when they meet the students again later in the year.
Takeaway Tips
- Tagging the questions as they are being created only takes a few extra seconds per question, and is less time-consuming than doing so retrospectively.
- Question tagging provides multiple benefits for question bank organisation, and facilitates the reviewing of class or individual student performance by category after an assessment is completed.
- The Summary Report is a useful tool that can provide an overview of the overall class performance and feedback to students
- By analysing and interpreting the reports, teachers can evaluate their own impact on students’ learning by identifying where the learning gaps are and make decisions on where to go next.
 |
LIM Li Zhen is a Senior Lecturer at the Faculty of Dentistry. She teaches modules in oral radiography and radiology to undergraduate and postgraduate dental students. Her research interests include evaluating the diagnostic impact and efficacy of imaging, and the use of technology-enhanced learning in dental education. Li Zhen can be reached at denllz@nus.edu.sg. |
Endnote
- Colleagues can refer to the Digital Assessment page (https://wiki.nus.edu.sg/display/DA/Self+Help) for details on how to set up ExamSoft. This wiki is only accessible to NUS staff.
References
Gan J. S., & Wu H. X. (2019). Using ExamSoft for digital assessment and feedback [Seminar]. Centre for Development of Teaching and Learning.
Rudolph, M. J., Daugherty, K. K., Ray, M. E., Shuford, V. P., Lebovitz, L., & DiVall, M. V. (2019). Best practices related to examination item construction and post-hoc review. Am J Pharm Educ, 83(7), 7204. http://dx.doi.org/10.5688/ajpe7204
