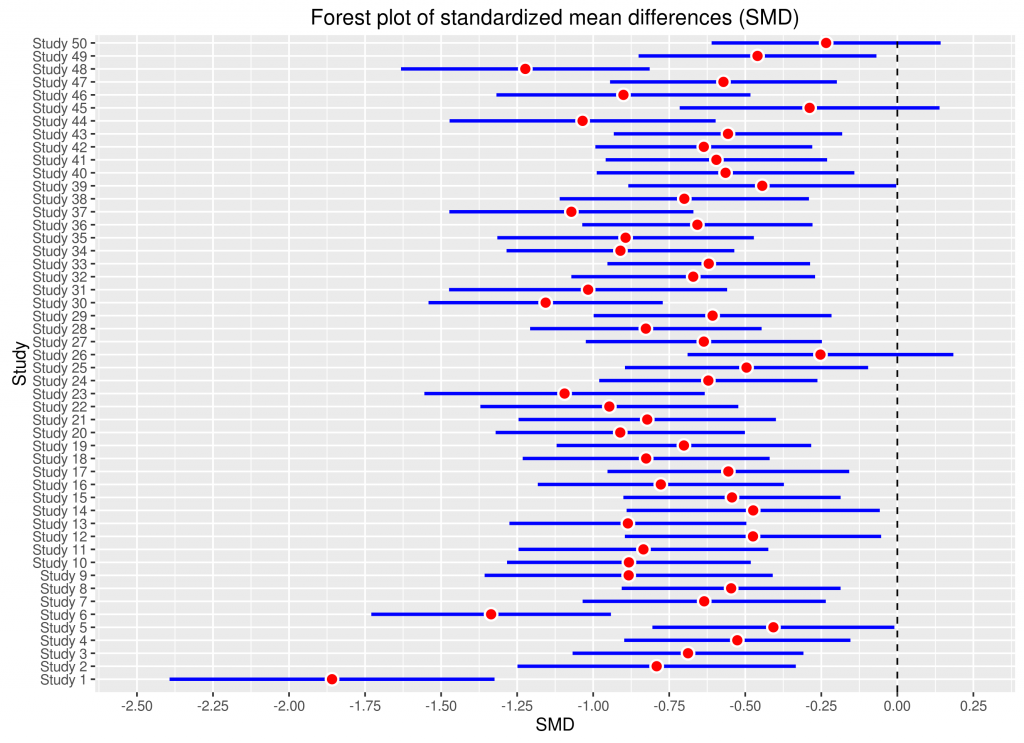
Guide by Dr. Mike Cheung and Ranjith Vijayakumar offers a summary of background knowledge on conducting a meta-analytic study.
When synthesizing and combining research findings in a discipline, conducting a meta-analysis of individual studies is a useful way to statistically estimate the magnitude of the effect.
A recent introductory guide by Dr. Mike Cheung and Ph.D. candidate, Ranjith Vijayakumar, from the Department of Psychology in NUS, has discussed when and how to conduct a meta-analysis.
The authors suggest that a meta-analysis may be particularly useful if the topic is of high importance to human lives and society, and if there are sufficient primary studies available. Primary studies can be identified and included based on comprehensive literature searching strategies, such as combing through databases that are relevant to the field in question.
Three common effect sizes are often used in meta-analytic procedures: 1) odds ratios based on binary outcomes, 2) mean differences, and 3) correlation coefficients. The choice of effect size depends on the research question of interest — whereas odds ratios are frequently used in the medical and health sciences, mean differences are commonly used in experimental or between-group comparisons, while correlation coefficients are used in observational studies. It is possible for researchers to convert these effect sizes as necessary, besides computing their approximate sampling variances.
Researchers have to choose between two kinds of meta-analysis that posit different models about the population of effect sizes. If the effects are assumed the same across studies, a fixed-effects meta-analysis may be used. On the other hand, if it is understood that there are differences in study design, operationalization of construct, and measurement errors, then the studies are not investigating a single population effect size. Random meta-analysis takes into account this random variation between the true effect sizes estimated by each study.
Although published studies are susceptible to issues such as publication bias, different research designs and methods of individual studies, and non-independent effect sizes, there are statistical methods available to address these concerns. For example, the authors illustrate how a theory can be tested across different designs, measures, and samples via the use of random- and mixed-effects models.
The authors further illustrate various software packages for meta-analysis, such as Comprehensive Meta-Analysis, SPSS macro, Stata, Mplus, and the metaSEM package implemented in the R statistical environment. Readers may be interested in referring to supplemental materials (including a sample dataset, analyses, and output) provided by the authors, available at: https://goo.gl/amYoGC
Reference
Cheung, M. W.-L., & Vijayakumar, R. (2016). A guide to conducting a meta-analysis. Neuropsychology Review, 26, 121-128. http://dx.doi.org/10.1007/s11065-016-9319-z


Dear Ranjith & Prof. Cheung,
Thanks so much for this paper! I think it’s germane to those of us who are new to meta-analysis and want to learn to use it in our area of research. I just read and shared it with my graduate friends and the faculty!
Best,
GeckHong