One key advantage of Redux is making the app’s state mutation obvious, predicable and easy to manage.
Yet, in a complex application with several connected / asynchronous actions, debugging is still an inevitable eventuality.
Since the dawn of programming, debugging has been a tedious process that plagues every software developers. A myriad of debugging tools has been developed to ease the pain, at varying success rates.
In this post, I’ll explore our available options in debugging a Redux web/mobile application.
1. Manual logging — the naive way
If a reducer does not appear to be working, we can simply add console.log statements to print the previous state, action and the next state:
case EDIT_COMMENT: {

  console.log('prev state', state, 'action', action);

  const copy = state[action.questionId].slice();

  copy.some((comment, index) => {

    if (comment.commentId === action.commentId) {

      copy[index] = { // create a new obj as comment is not deep-copied

        ...comment,

        text: action.text,

        date: action.date,

      };

      return true;

    }

    return false;

  });

  console.log('next state', { ...state, [action.questionId]: copy });

  return {

    ...state,

    [action.questionId]: copy,

  };

}
Obviously, it’s rather tedious to do this every time u want to debug a reducer, and sometimes you might not be able to pinpoint which reducer is problematic, in which case you might end up manually adding it for all your reducers.
2. Redux-logger — the lazy way
Redux-logger is a middleware that basically does the above process for you automatically: prints all Redux state changes and logs them.
To use it, we simply add it to our middleware
import logger from 'redux-logger';

const middleware = [thunk, routerMiddleware(history)];

if (process.env.NODE_ENV === 'development') {

  middleware.push(logger);

}

const store = createStore(reducer, applyMiddleware(...middleware));
And every state changes will now be logged to the console:
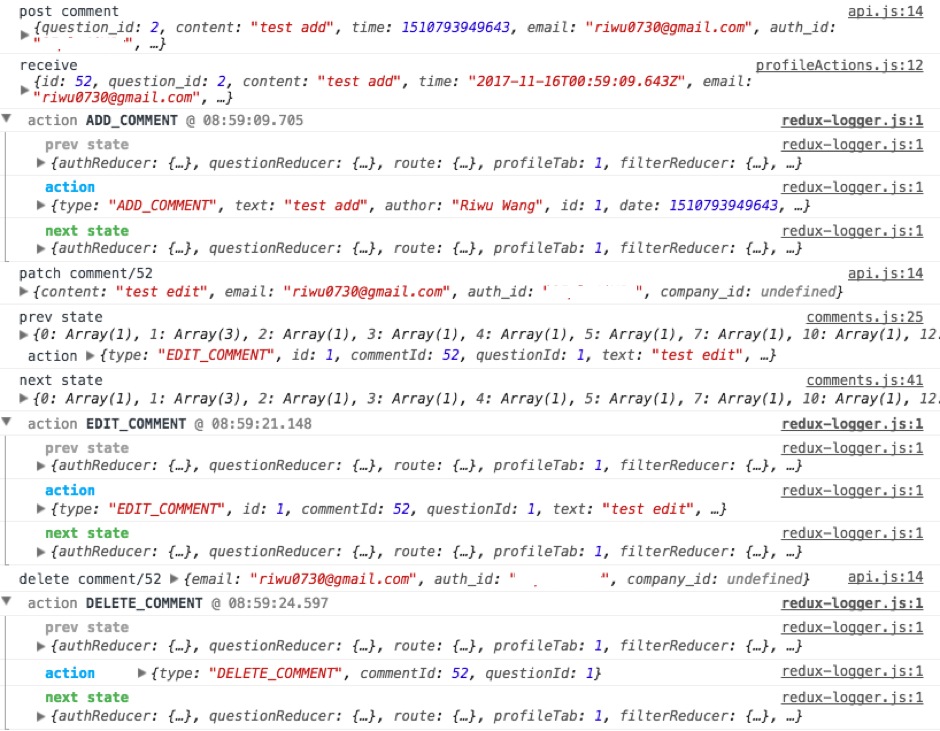
This is convenient, but it makes your other console.log statements hard to spot (unless you use a different level of logging for the rest of your applications, say console.warn). Furthermore, you have to examine the state one by one and figure out which part of the state changed manually.
3. Redux-devtools — the smart way
Like redux-logger, redux-devtool also logs all the state changes, except that it presents in a separate window with a much nicer GUI:

To use it, we simply download the extension and add it as a composer in `createStore`.
const composeEnhancers = (process.env.NODE_ENV === 'development' && window.__REDUX_DEVTOOLS_EXTENSION_COMPOSE__) || compose;

const store = createStore(

  reducer,

  composeEnhancers(applyMiddleware(...middleware)),

);
Or in React Native environment:
import { composeWithDevTools } from 'remote-redux-devtools';

...

composeWithDevTools(applyMiddleware(...middleware)),

...
As seen in the above screenshot, the tool also compute the state diff after every action. It also comes with various additional features such as time-travelling*, state tree overview and a nice chart:

As cliché as it sounds, this is an essential tool for all Redux developers!
4. Redux-logger-server — the masochistic way
This is a tool that does the exact same thing as redux-logger, except it logs to your server instead.
Why would anyone want to pollute the server log with redux state changes?
I supposed its only purpose is to try tracking down a bug that your clients are reporting but neither of you could replicate it deterministically.
Leave a Reply